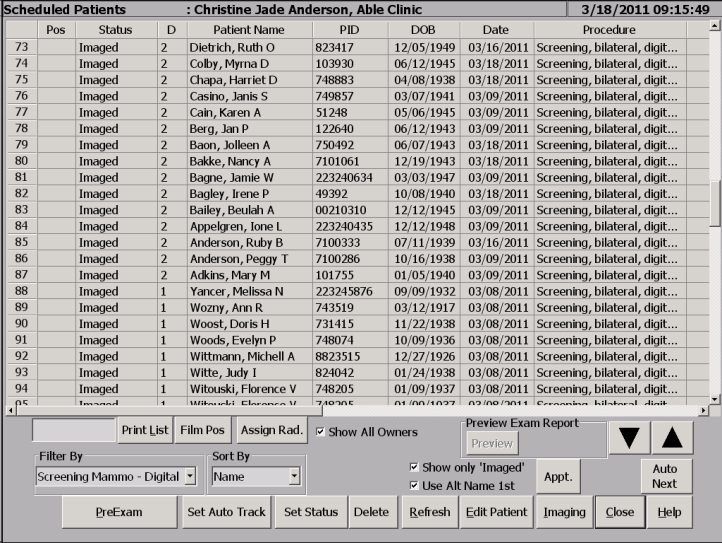
PenRad’s worklist can be ordered by the tissue density (1-4 where dense is 4) by the last specified exam density by tapping on the Density (D) column to sort exams or selecting from the Sort By control by Density/Exam Date or Exam Date/Density.
PenRad’s tissue density filtering system provides efficiencies in interpretation and distribution of exams. In addition, hanging protocols according to breast density may be created providing optimization in physician workflow.
This is one of the many standard workflow enhancing features available with the PenView softcopy review workstation.
By incorporating Volpara (first FDA cleared software for quantitative analysis of breast density and volume for FFDM), tissue density is automatically calculated and delivered to the PenRad worklist (D-Density column) and to the narrative report. See www.volparadensity.com or www.PenRad.com for information.


TIP: For maximizing interpretation with a common mind set, start themorning with fatty (D=1) and progress to dense tissue (D=4); or assign exams by tissue density based on radiologist preference.
To learn more about how PenRad’s PenView and Compass for breast MRI can further optimize interpretation efficiencies by providing a common platform for all breast related studies in the women’s imaging center (MG, US,MRI, NM, DX, CT), visit www.PenRad.com.

Recommendation for product development?
[email protected] | 763.475.3388
© 2019 PenRad Technologies, Inc. 730-23-00045 AB